-
Product Sales Excluding Veklury Increased 4% Year-Over-Year to $28.0 billion for Full Year 2025
-
Biktarvy Sales Increased 7% Year-Over-Year to $14.3 billion for Full Year 2025
FOSTER CITY, Calif.--(BUSINESS WIRE)-- Gilead Sciences, Inc. (Nasdaq: GILD) announced today its results of operations for the fourth quarter and full year 2025.
“Our fourth quarter and full-year results close out a very strong year for Gilead overall, including the successful U.S. launch of Yeztugo, the world’s first twice-yearly HIV prevention therapy, and continued growth for Biktarvy and Descovy,” said Daniel O’Day, Gilead’s Chairman and Chief Executive Officer. “In 2026, our potential new launches include two cancer therapies and an additional HIV treatment option, and we look forward to building on the launches of Yeztugo and Livdelzi for liver disease. As we continue to increase our positive impact on healthcare, Gilead is well positioned for continued growth in 2026 and beyond.”
Fourth Quarter 2025 Financial Results
-
Total fourth quarter 2025 revenues increased 5% to $7.9 billion compared to the same period in 2024, primarily driven by higher sales of HIV and Liver Disease products, partially offset by lower sales of Veklury® (remdesivir).
-
Diluted earnings per share (“EPS”) was $1.74 in the fourth quarter 2025 compared to $1.42 in the same period in 2024. The increase was primarily driven by higher income tax benefits, net unrealized gains from equity securities and higher product sales, as well as lower selling, general and administrative (“SG&A”) expenses. The increase was partially offset by higher acquired in-process research and development (“IPR&D”) expenses and an IPR&D impairment charge related to assets acquired as part of the MYR GmbH (“MYR”) acquisition.
-
Non-GAAP diluted EPS of $1.86 in the fourth quarter 2025 compared to $1.90 in the same period in 2024. The decrease was primarily driven by higher acquired IPR&D expenses, partially offset by higher product sales and lower SG&A expenses.
-
As of December 31, 2025, Gilead had $10.6 billion of cash, cash equivalents and marketable debt securities compared to $10.0 billion as of December 31, 2024.
-
During the fourth quarter 2025, Gilead generated $3.3 billion in operating cash flow.
-
During the fourth quarter 2025, Gilead paid dividends of $1.0 billion and repurchased $230 million of common stock.
Fourth Quarter 2025 Product Sales
Total fourth quarter 2025 product sales increased 5% to $7.9 billion compared to the same period in 2024. Total fourth quarter 2025 product sales excluding Veklury increased 7% to $7.7 billion compared to the same period in 2024, primarily due to higher sales of HIV and Liver Disease products.
HIV product sales increased 6% to $5.8 billion in the fourth quarter 2025 compared to the same period in 2024, primarily driven by higher demand for HIV prevention and treatment.
-
Biktarvy®(bictegravir 50mg/emtricitabine (“FTC”) 200mg/tenofovir alafenamide (“TAF”) 25mg) sales increased 5% to $4.0 billion in the fourth quarter 2025 compared to the same period in 2024, primarily driven by higher demand and favorable inventory dynamics, partially offset by lower average realized price.
-
Descovy®(FTC 200mg/TAF 25mg) sales increased 33% to $819 million in the fourth quarter 2025 compared to the same period in 2024, primarily driven by higher average realized price and higher demand for HIV prevention.
The Liver Disease portfolio sales increased 17% to $844 million in the fourth quarter 2025 compared to the same period in 2024, primarily driven by higher demand for Livdelzi® (seladelpar).
Veklury sales decreased 37% to $212 million in the fourth quarter 2025 compared to the same period in 2024, primarily driven by lower rates of COVID-19-related hospitalizations.
Cell Therapy product sales decreased 6% to $458 million in the fourth quarter 2025 compared to the same period in 2024, reflecting ongoing competitive headwinds.
-
Yescarta® (axicabtagene ciloleucel) sales decreased 6% to $368 million in the fourth quarter 2025 compared to the same period in 2024, primarily driven by in- and out-of-class competition.
-
Tecartus® (brexucabtagene autoleucel) sales decreased 9% to $90 million in the fourth quarter 2025 compared to the same period in 2024, primarily driven by in-class competition.
Trodelvy® (sacituzumab govitecan-hziy) sales increased 8% to $384 million in the fourth quarter 2025 compared to the same period in 2024, primarily driven by higher demand in breast cancer treatment.
Fourth Quarter 2025 Product Gross Margin, Operating Expenses and Effective Tax Rate
-
Product gross margin remained relatively flat at 79.5% in the fourth quarter 2025 compared to 79.0% in the same period in 2024. Non-GAAP product gross margin was 86.8% in the fourth quarter 2025 compared to 86.7% in the same period in 2024.
-
Research and development (“R&D”) expenses and non-GAAP R&D expenses were $1.6 billion in the fourth quarter 2025 and remained relatively flat compared to the same period in 2024.
-
Acquired IPR&D expenses were $539 million in the fourth quarter 2025, primarily related to our acquisition of Interius BioTherapeutics, Inc. (“Interius”) and ongoing collaboration with Shenzhen Pregene Biopharma Co., Ltd. (“Pregene”).
-
SG&A expenses were $1.8 billion in the fourth quarter 2025 compared to $1.9 billion in the same period in 2024, decreasing primarily due to lower expenses related to legal matters and corporate initiatives, partially offset by donations of equity securities made to the Gilead Foundation. Non-GAAP SG&A expenses were $1.7 billion in the fourth quarter 2025 compared to $1.9 billion in the same period in 2024, primarily due to lower expenses related to legal matters and corporate initiatives.
-
The effective tax rate (“ETR”) was (5.0)% in the fourth quarter 2025 compared to 17.8% in the same period in 2024, primarily driven by a tax benefit from a settlement with a tax authority related to a prior year legal entity restructuring and a tax benefit from the IPR&D impairment charge related to assets acquired as part of the MYR acquisition. The non-GAAP ETR was 20.5% in the fourth quarter 2025 compared to 19.2% in the same period in 2024.
Full Year 2025 Financial Results
-
Total full year 2025 revenues increased 2% to $29.4 billion compared to 2024, broken down as follows:
-
Total full year 2025 product sales increased 1% to $28.9 billion compared to 2024, primarily driven by higher sales of HIV and Liver Disease products, partially offset by lower sales of Veklury.
-
Total full year 2025 royalty, contract and other revenues increased by approximately $383 million compared to 2024, primarily driven by revenue related to a previous sale of intellectual property not expected to reoccur.
-
Diluted EPS was $6.78 in the full year 2025 compared to $0.38 in 2024. The increase was primarily driven by lower acquired IPR&D expenses, lower IPR&D impairments, higher net unrealized gains on equity investments, higher revenues and lower SG&A expenses, partially offset by higher tax expense.
-
Non-GAAP diluted EPS was $8.15 in the full year 2025 compared to $4.62 in 2024. The increase was primarily driven by lower acquired IPR&D expenses, higher revenues, and lower SG&A expenses.
Full Year 2025 Product Sales
Total full year 2025 product sales increased 1% to $28.9 billion compared to 2024. Total full year 2025 product sales excluding Veklury increased 4% to $28.0 billion compared to 2024, primarily due to higher sales of HIV and Liver Disease products.
HIV product sales increased 6% to $20.8 billion in the full year 2025 compared to 2024, primarily driven by higher demand for HIV treatment and prevention.
-
Biktarvy sales increased 7% to $14.3 billion in the full year 2025 compared to 2024, primarily driven by higher demand, partially offset by lower average realized price.
-
Descovy sales increased 31% to $2.8 billion in the full year 2025 compared to 2024, primarily driven by higher demand and average realized price.
The Liver Disease portfolio sales increased 6% to $3.2 billion in the full year 2025 compared to 2024, primarily driven by higher demand for Livdelzi and products for chronic hepatitis B virus (“HBV”) and chronic hepatitis delta virus (“HDV”), partially offset by lower average realized price in products for chronic hepatitis C virus (“HCV”).
Veklury sales decreased 49% to $911 million in the full year 2025 compared to 2024, primarily driven by lower COVID-19-related hospitalizations.
Cell Therapy product sales decreased 7% to $1.8 billion in the full year 2025 compared to 2024, reflecting ongoing competitive headwinds.
-
Yescarta sales decreased 5% to $1.5 billion in the full year 2025 compared to 2024, primarily driven by in- and out-of-class competition.
-
Tecartus sales decreased 15% to $344 million in the full year 2025 compared to 2024, primarily driven by in-class competition.
Trodelvy sales increased 6% to $1.4 billion in the full year 2025 compared to 2024, primarily driven by higher demand in breast cancer treatment, partially offset by the indication withdrawal in bladder cancer treatment.
Full Year 2025 Product Gross Margin, Operating Expenses and Effective Tax Rate
-
Product gross margin remained relatively flat at 78.4% in the full year 2025 compared to 78.2% in 2024. Non-GAAP product gross margin was 86.4% in the full year 2025 compared to 86.2% in 2024.
-
R&D expenses were $5.8 billion in the full year 2025 compared to $5.9 billion in 2024, decreasing primarily due to lower acquisition-related integration expenses and restructuring costs, as well as lower study-related and clinical manufacturing expenses. Non-GAAP R&D expenses were $5.7 billion in the full year 2025, decreasing slightly compared to 2024 due to lower study-related and clinical manufacturing expenses.
-
Acquired IPR&D expenses were $1.0 billion in the full year 2025, primarily related to the acquisition of Interius and collaborations with LEO Pharma A/S and Pregene.
-
SG&A expenses were $5.8 billion in the full year 2025 compared to $6.1 billion in 2024, decreasing primarily due to lower corporate, legal, acquisition-related integration and restructuring expenses, partially offset by higher HIV promotional expenses and donations of equity securities made to the Gilead Foundation. Non-GAAP SG&A expenses were $5.6 billion in the full year 2025 compared to $5.9 billion in 2024, decreasing primarily due to lower expenses related to corporate initiatives and legal matters, partially offset by higher HIV promotional expenses.
-
The ETR was 13.1% in the full year 2025 compared to 30.5% in 2024, primarily driven by the impact of the prior year non-deductible acquired IPR&D charge for the acquisition of CymaBay Therapeutics, Inc. (“CymaBay”), partially offset by the tax impact of the prior year higher IPR&D impairment charges. The non-GAAP ETR was 18.3% in the full year 2025 compared to 25.9% in 2024, primarily driven by the prior year non-deductible acquired IPR&D charge for the acquisition of CymaBay.
Guidance and Outlook
For the full year 2026, Gilead expects:
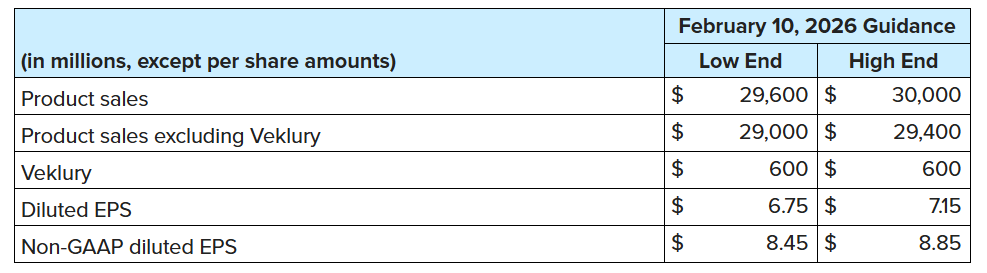
Additional information and a reconciliation between GAAP and non-GAAP financial information for the 2026 guidance is provided in the accompanying tables. The financial guidance is subject to a number of risks and uncertainties. See the Forward-Looking Statements section below.
Non-GAAP Financial Information
The information presented in this document has been prepared in accordance with U.S. generally accepted accounting principles (“GAAP”), unless otherwise noted as non-GAAP. Management believes non-GAAP information is useful for investors, when considered in conjunction with Gilead’s GAAP financial information, because management uses such information internally for its operating, budgeting and financial planning purposes. Non-GAAP information is not prepared under a comprehensive set of accounting rules and should only be used to supplement an understanding of Gilead’s operating results as reported under GAAP. Non-GAAP financial information generally excludes acquisition-related expenses including amortization of acquired intangible assets and other items that are considered unusual or not representative of underlying trends of Gilead’s business, fair value adjustments of equity securities and discrete and related tax charges or benefits associated with such exclusions as well as changes in tax-related laws and guidelines, transfers of intangible assets between certain legal entities, and legal entity restructurings. Although Gilead consistently excludes the amortization of acquired intangible assets from the non-GAAP financial information, management believes that it is important for investors to understand that such intangible assets were recorded as part of acquisitions and contribute to ongoing revenue generation. Non-GAAP measures may be defined and calculated differently by other companies in the same industry. Reconciliations of the non-GAAP financial measures to the most directly comparable GAAP financial measures are provided in the accompanying tables.
About Gilead Sciences
Gilead Sciences, Inc. is a biopharmaceutical company that has pursued and achieved breakthroughs in medicine for more than three decades, with the goal of creating a healthier world for all people. The company is committed to advancing innovative medicines to prevent and treat life-threatening diseases, including HIV, viral hepatitis, COVID-19, cancer and inflammation. Gilead operates in more than 35 countries worldwide, with headquarters in Foster City, California.